What you end up with
A fleet dashboard built from the template, connected to live Azure Table Storage. Headline numbers across the top, status breakdown and a one-row-per-device table in the middle, control coverage along the bottom.
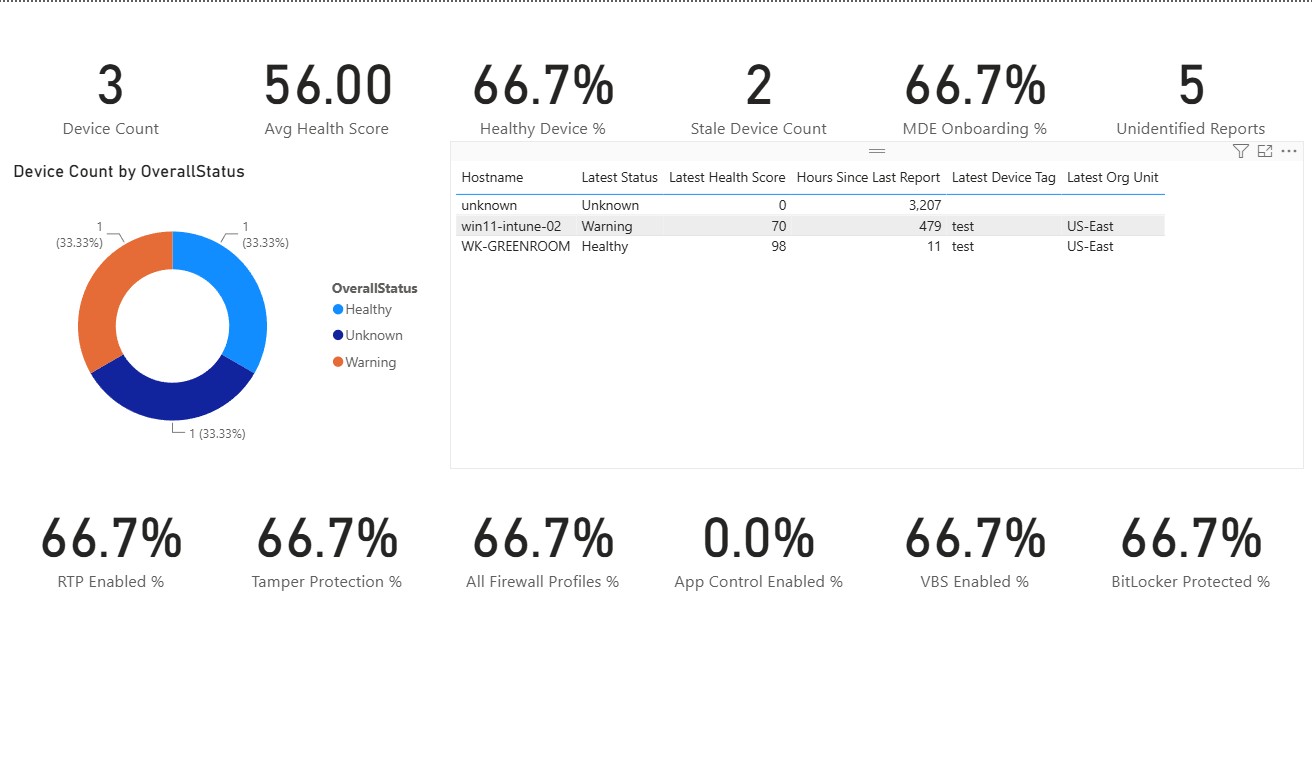 Fleet Health page — built from MDE-Toolkit-Fleet-Health.pbit
Device Count sitting first, before any percentage: a lone “66.7%” would hide whether it means two machines out of three or two thousand out of three thousand.
Note also Unidentified Reports: 5 and the unknown row in the table. Those are real uploads that arrived without a hostname — they are shown rather than hidden, because they inflate Device Count and drag Avg Health Score down. See the note at the end of this section.
Ready-to-Use Files
.pbix.
.pbix? A .pbix stores its model as a compressed binary Analysis Services database, which only Power BI Desktop can produce — it cannot be generated or checked into source control meaningfully. A .pbit holds the same model as JSON and carries no data, so it can be built from the query and measures in this repo and regenerated whenever they change.
You will be prompted for StorageAccountName, TableName, EndpointSuffix (use table.core.usgovcloudapi.net for Government) and StaleAfterHours. Then supply the storage account key when asked to authenticate.
If the report page fails to open on your Desktop build, use MDE-Toolkit-Fleet-Health-Blank.pbit — identical model and measures, one empty page to build on.
HealthReports-Query.m— Power Query for Commercial cloudHealthReports-Query-GovCloud.m— Power Query for Azure GovernmentMeasures.dax— 114 DAX measuresMDE-Toolkit-Theme.json— report theme (View → Themes → Browse for themes)README.md— Full setup guide with report layout
Quick Start
- In Power BI Desktop → Home → Get Data → Blank Query
- Click Advanced Editor and paste
HealthReports-Query.m(or the Gov Cloud variant) - Update the CONFIGURATION block at the top — at minimum
StorageAccountNameandTableName - Authenticate with the storage Account Key — see the callout below
- Click Close & Apply
- Modeling → New Measure — add
Device Countfirst, then the rest fromMeasures.dax
Storage Table Data Reader have no effect here — granting one and expecting Power BI to use it gives Expression.Error: Access to the resource is forbidden.
Copy it from Storage account → Security + networking → Access keys → key1. An account key grants full read/write access to every table, queue and blob in that account, and this connector accepts no read-only or table-scoped alternative, so rotate it on a schedule. Power BI holds it in its own credential store, not in the .m file.
This is the reporting side only. Endpoints still hold no secrets — they authenticate with the signed-in user's Entra token and the Function App writes to storage with its Managed Identity.
RowKey as <Hostname>_<ReportId> and the collector does not send a report ID, so every upload adds a row — roughly 90 a month per device. That history is useful, but it means COUNTROWS counts reports, so a device that reports more often carries more weight in any fleet percentage.
The query adds an IsLatestPerDevice column and every supplied measure filters on it, so the numbers come out per device. Use all rows only for trends over time.
Building the dashboard
The template ships the page in the screenshot above. This is how it is put together, so you can extend it or rebuild it by hand.
1. Top row — the headline
Six Card visuals. Drag the measure onto a card; there is nothing else to configure.
| Card | Why it earns its place |
|---|---|
Device Count | The denominator. Put it first so every percentage beside it can be read honestly. |
Avg Health Score | One number for “how are we doing”, averaged one vote per device. |
Healthy Device % | Share scoring 70 or above. |
Stale Device Count | Devices that stopped reporting. Often the most actionable number on the page. |
MDE Onboarding % | Coverage gap in Defender for Endpoint itself. |
Unidentified Reports | Uploads that arrived with no hostname — see the warning below. |
2. Middle left — status breakdown
A Donut chart: OverallStatus on Legend, Device Count on Values. Using the measure rather than a row count is what keeps it per-device.
Device Count is deliberately the one count measure not wrapped in COALESCE. A category chart drops a category when the measure is blank but keeps it when the measure is zero, so forcing a zero would list every status that no current device holds — Critical, or a blank status from an old row — in the legend with no slice.
3. Middle right — the device table
A Table visual with Hostname and then measures only:
Latest StatusLatest Health ScoreHours Since Last ReportLatest Device TagLatest Org Unit
OverallStatus, HealthScore, HoursSinceReport — onto the table produces one row per report. A machine that has uploaded ninety times appears ninety times, and the table becomes unreadable.
With Hostname as the only grouping column and everything else a measure, Power BI collapses to one row per device and each measure resolves to that device's most recent value. No page filter required.
Total | Warning | 98 | 11 that means nothing. The template ships with totals already disabled.
4. Bottom row — control coverage
Six more cards: RTP Enabled %, Tamper Protection %, All Firewall Profiles %, App Control Enabled %, VBS Enabled %, BitLocker Protected %. Swap in whichever controls your organisation actually cares about — there are 114 measures to choose from.
5. Apply the theme
View → Themes → Browse for themes and pick MDE-Toolkit-Theme.json. Beyond matching the toolkit palette it sets the good / neutral / bad slots, so conditional formatting on Latest Health Score gives sensible colours without picking hex values by hand.
6. Save as a .pbix
File → Save As. From that point it is an ordinary report — add pages, publish it, schedule refresh.
Unidentified Reports is not zero, some uploads reached the Function App without a hostname and were stored under the literal unknown. They then group together as a single synthetic device, inflating Device Count by one and dragging Avg Health Score down.
The Function App takes the hostname from the X-Device-Hostname header, falling back to hostname or machineName in the payload, and only then to unknown. A non-zero count means a sender is supplying none of the three — usually an old build or a hand-crafted POST. Fix it at the source rather than filtering it out of the report, because a device you cannot name is a device you cannot chase.
What the Query Gives You
- Connects to Azure Table Storage and expands all 100+ flat columns written by the Function App
- Survives the schemaless table. Table Storage stores no schema and the Function App omits null properties, so a device that has never run a full scan has no
LastFullScanUtcproperty at all. Each row is merged onto a template of nulls before expanding, so a missing property becomes a null instead of failing the whole refresh - Correct types: boolean, integer, datetimezone, text — with a date parser that accepts both ISO 8601 and the locale-formatted dates written by older Function App builds
- Computed columns:
HoursSinceReport,IsStale,AllFirewallProfilesEnabled,HealthBucket,IsLatestPerDevice - Sorted newest first
TextColumns / BoolColumns / IntColumns / DateColumns list in the query rather than expanding it directly — that is what keeps it resilient to missing properties. Keep the lists in step with run.ps1.
DAX Measures
All posture measures are scoped to the newest report per device and count distinct hostnames, so percentages mean “share of devices” rather than “share of reports”. Counts return 0 rather than blank, so an empty result reads as a real zero instead of missing data.
📊 Fleet Overview
Device Count, Avg Health Score, Healthy Device %, Stale Device Count, Unidentified Reports
🖥️ Latest Value Per Device
Latest Status, Latest Health Score, Hours Since Last Report, Latest Device Tag, Latest Org Unit, Latest OS Version — use these to build a device table that has one row per machine
🛡️ Defender AV
RTP Enabled %, Tamper Protection %, Behavior Monitoring %, Avg Signature Age (hrs), Stale Signatures Count
📡 MDE / Sense
MDE Onboarding %, Sense Not Running
⚔️ ASR Rules
ASR Configured %, Avg ASR Block Rules, Avg ASR Audit Rules, ASR Audit Only Devices
🔥 Firewall
All Firewall Profiles %, Firewall Gaps
🔒 VBS / HVCI
VBS Enabled %, HVCI Running %, Credential Guard %, HVCI Pending Reboot
💽 Platform Security
BitLocker Protected %, Secure Boot %, TPM Enabled %
🔄 OS Hygiene
Avg Days Since Update, Behind On Updates, RDP Exposed Devices
📈 Trends
Avg Health Score (All Reports), Reports Received, Devices Reporting In Period — these use every row
The six pages
The template ships all of these. The screenshot at the top of this page is the first one.
| Page | Answers | Fields it surfaces |
|---|---|---|
| Fleet Health | How many devices, how healthy, who has stopped reporting. | Health score, status, staleness, onboarding, the six headline controls. |
| Defender & ASR | Is the engine current, and are the rules actually blocking? | Engine / signature / platform versions, scan timestamps, ASR block vs audit counts, Network Protection block vs audit, Controlled Folder Access. |
| Hardening | Which enforcement controls are on, and which are only pretending. | App Control enforcement mode and policy count, Device Control mode and rule count, SmartScreen, Exploit Protection DEP / ASLR / CFG, firewall gaps. |
| Platform & ID | Is the hardware root of trust in place, and how are these machines joined? | BitLocker, Secure Boot, TPM, VBS, HVCI, Credential Guard, Entra / Hybrid join, trust type, domain. |
| OS & Local Risk | Patch currency and the local-privilege picture. | Windows Update age and build, PowerShell execution policy / constrained language / script block logging, RDP, LAPS, local administrator counts, boot time, agent version drift. |
| Issues | What is wrong, in the collector's own words. | TopIssues and critical event counts per device — the most directly actionable field in the schema. |
AV Engine Versions, Signature Versions, Agent Versions and OS Builds. These count values, not devices — so they answer “how fragmented is the fleet”. On a managed estate anything much above one or two usually means something has stopped updating.
- Enforced — Code Integrity is running the policies and blocking.
- Audit — running and logging, but not blocking.
- Deployed —
.cippolicy files are on disk and Code Integrity is not running them. They protect nothing.
That last state is the dangerous one: someone shipped policies and believes the machines are covered. App Control Inert Devices counts exactly those, and App Control Deployed % next to App Control Enforcing % shows the gap at a glance.
What is collected but not on a page
0 — which looks like a measured zero but is really “never checked”.
Devices need to upload at least once on the newer build before those panels mean anything. Agent Versions on the OS & Local Risk page tells you how far through that rollout you are.
The Function App writes 103 fields and the measures now reach 63 of them. Most of the rest are the collector's own rollup labels — DefenderAvStatus, FirewallStatus, VbsStatus and friends — which duplicate booleans already shown. They are still in the model, and they make excellent slicers: drop OverallStatus, DeviceTag, OrgUnit or Environment onto any page to filter it.
ReportJson is deliberately excluded from the query by default; it is up to 30,000 characters per row.
Every page, as shipped
Click any image to enlarge. These are from a small lab, so the percentages are blunt — the point is the shape of each page, not the numbers.
1 · Fleet Health
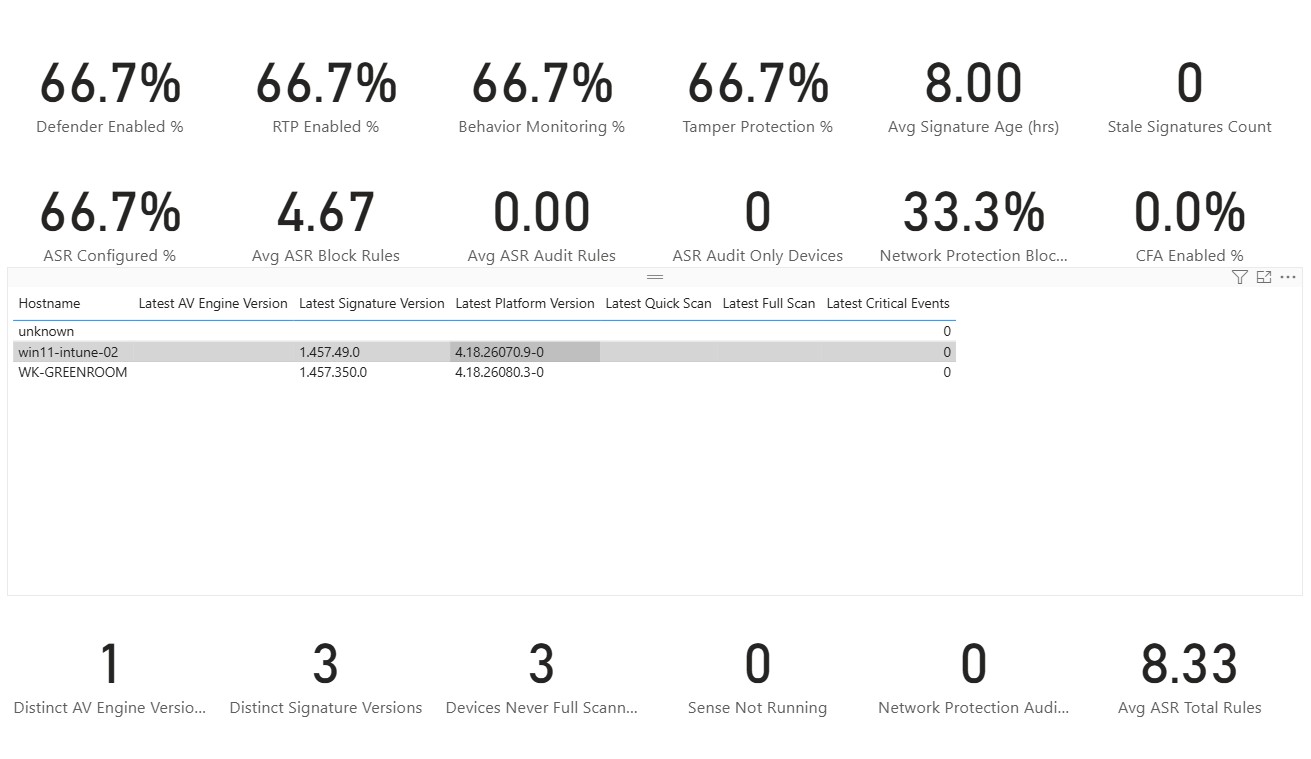 2 · Defender & ASR
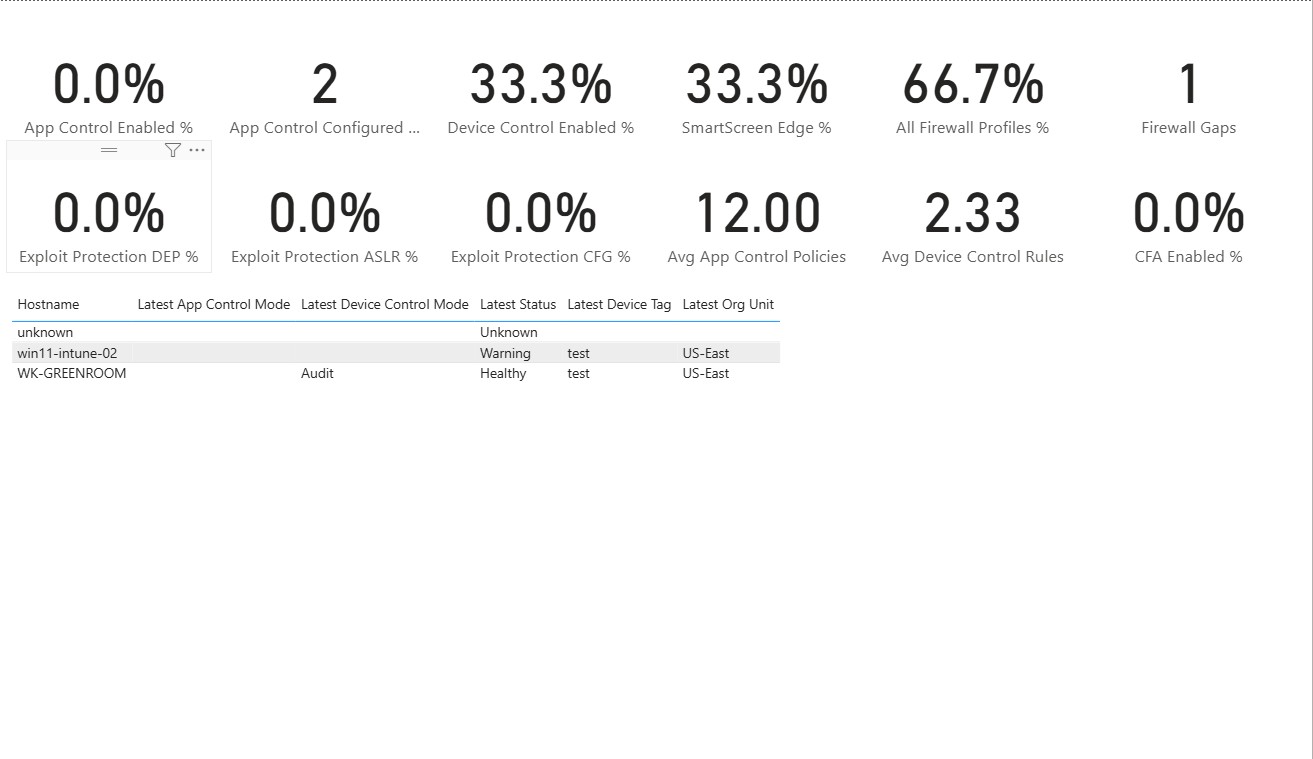 3 · Hardening
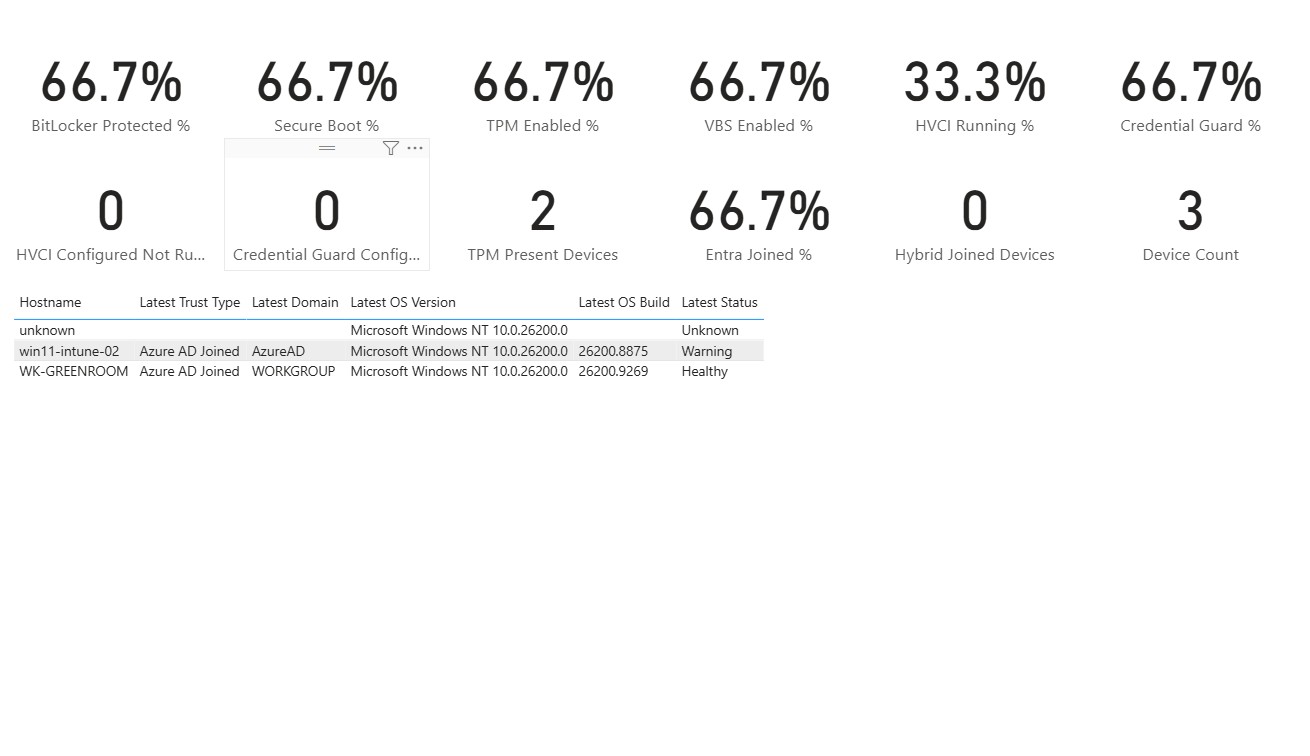 4 · Platform & ID
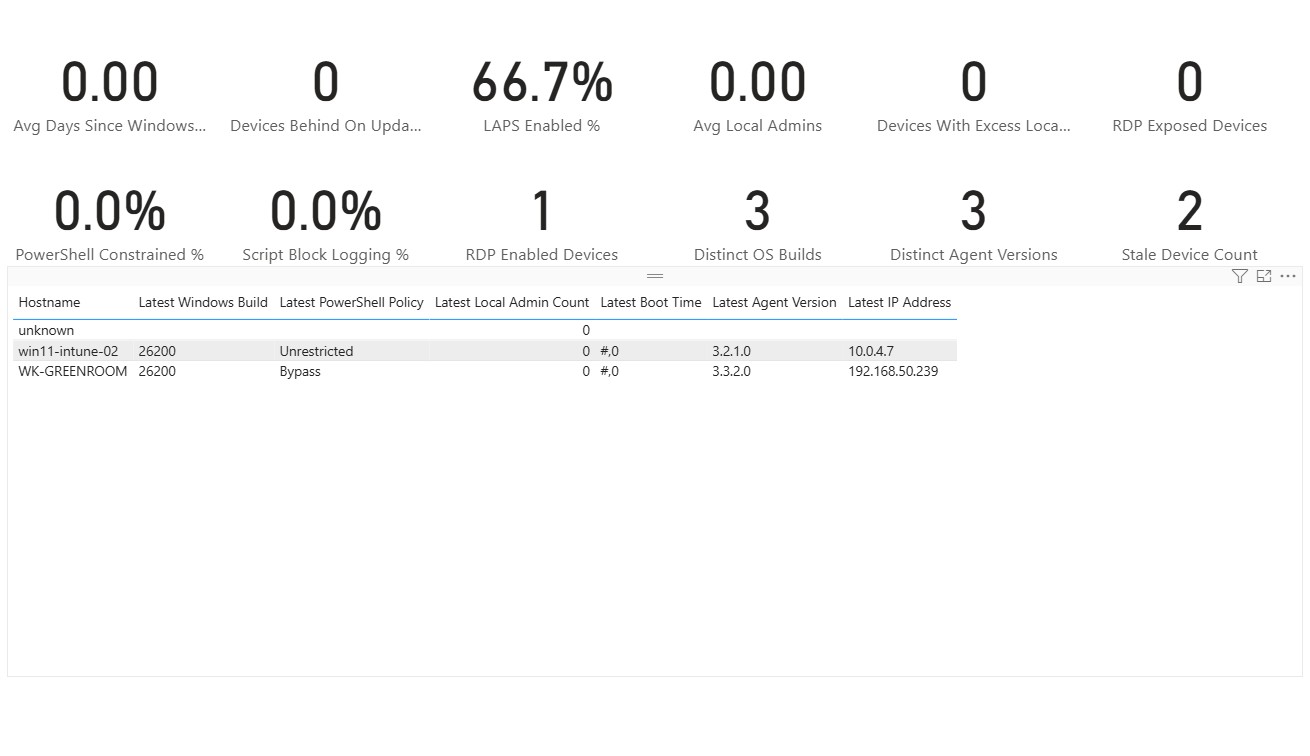 5 · OS & Local Risk
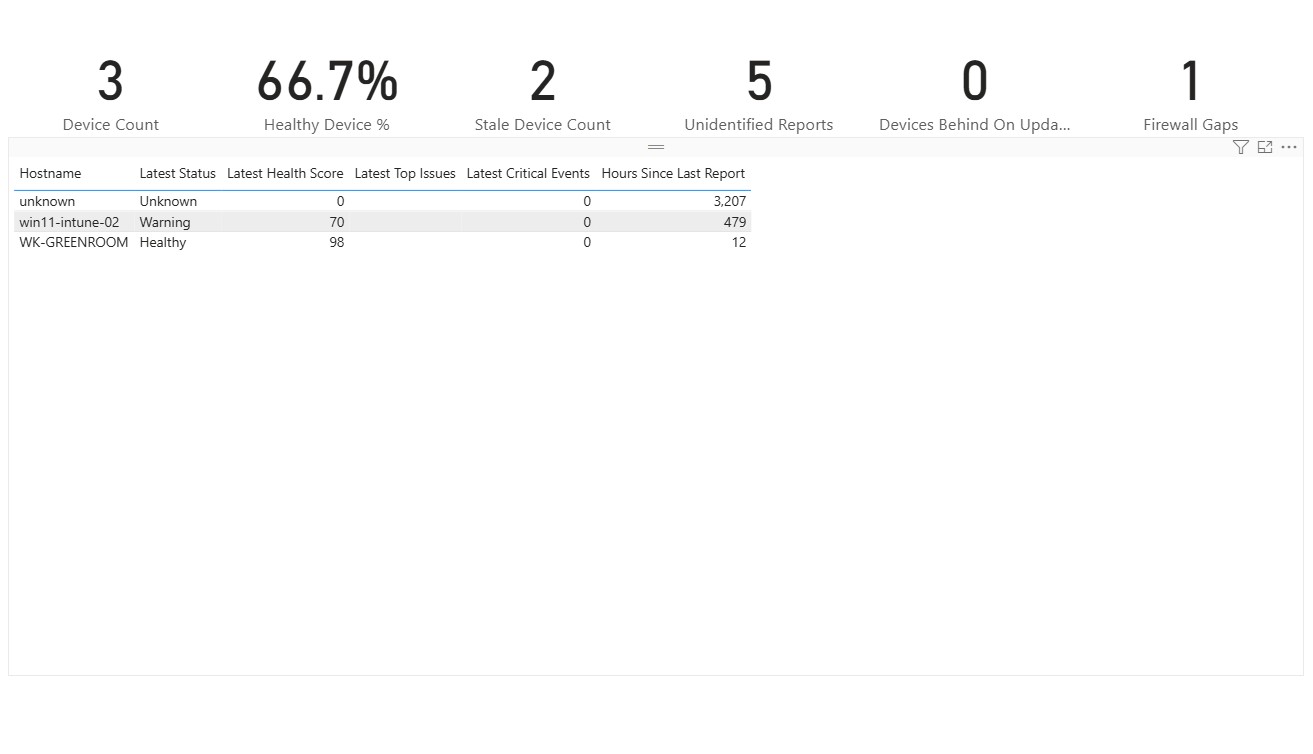 6 · Issues
Worth adding yourself
📈 A trend page
Line chart of GeneratedAtUtc against Avg Health Score (All Reports), Reports Received and Devices Reporting In Period. This is the one page that must not be scoped to the latest report, which is why those three measures are the only ones not filtered on IsLatestPerDevice.
🎚️ Slicers
Add DeviceTag, OrgUnit and Environment to whichever pages you use most. They exist as promoted columns precisely so you can cut the fleet by business unit, site or environment.